In the first 2 articles of our mini-series on Auction Theory, we discussed ways to measure market value. In the current third installment, we will elevate the entire concept and, using a practical example from the S&P 500 index, we will connect our previous knowledge to the creation of a comprehensive narrative.
Cumulative Profiling
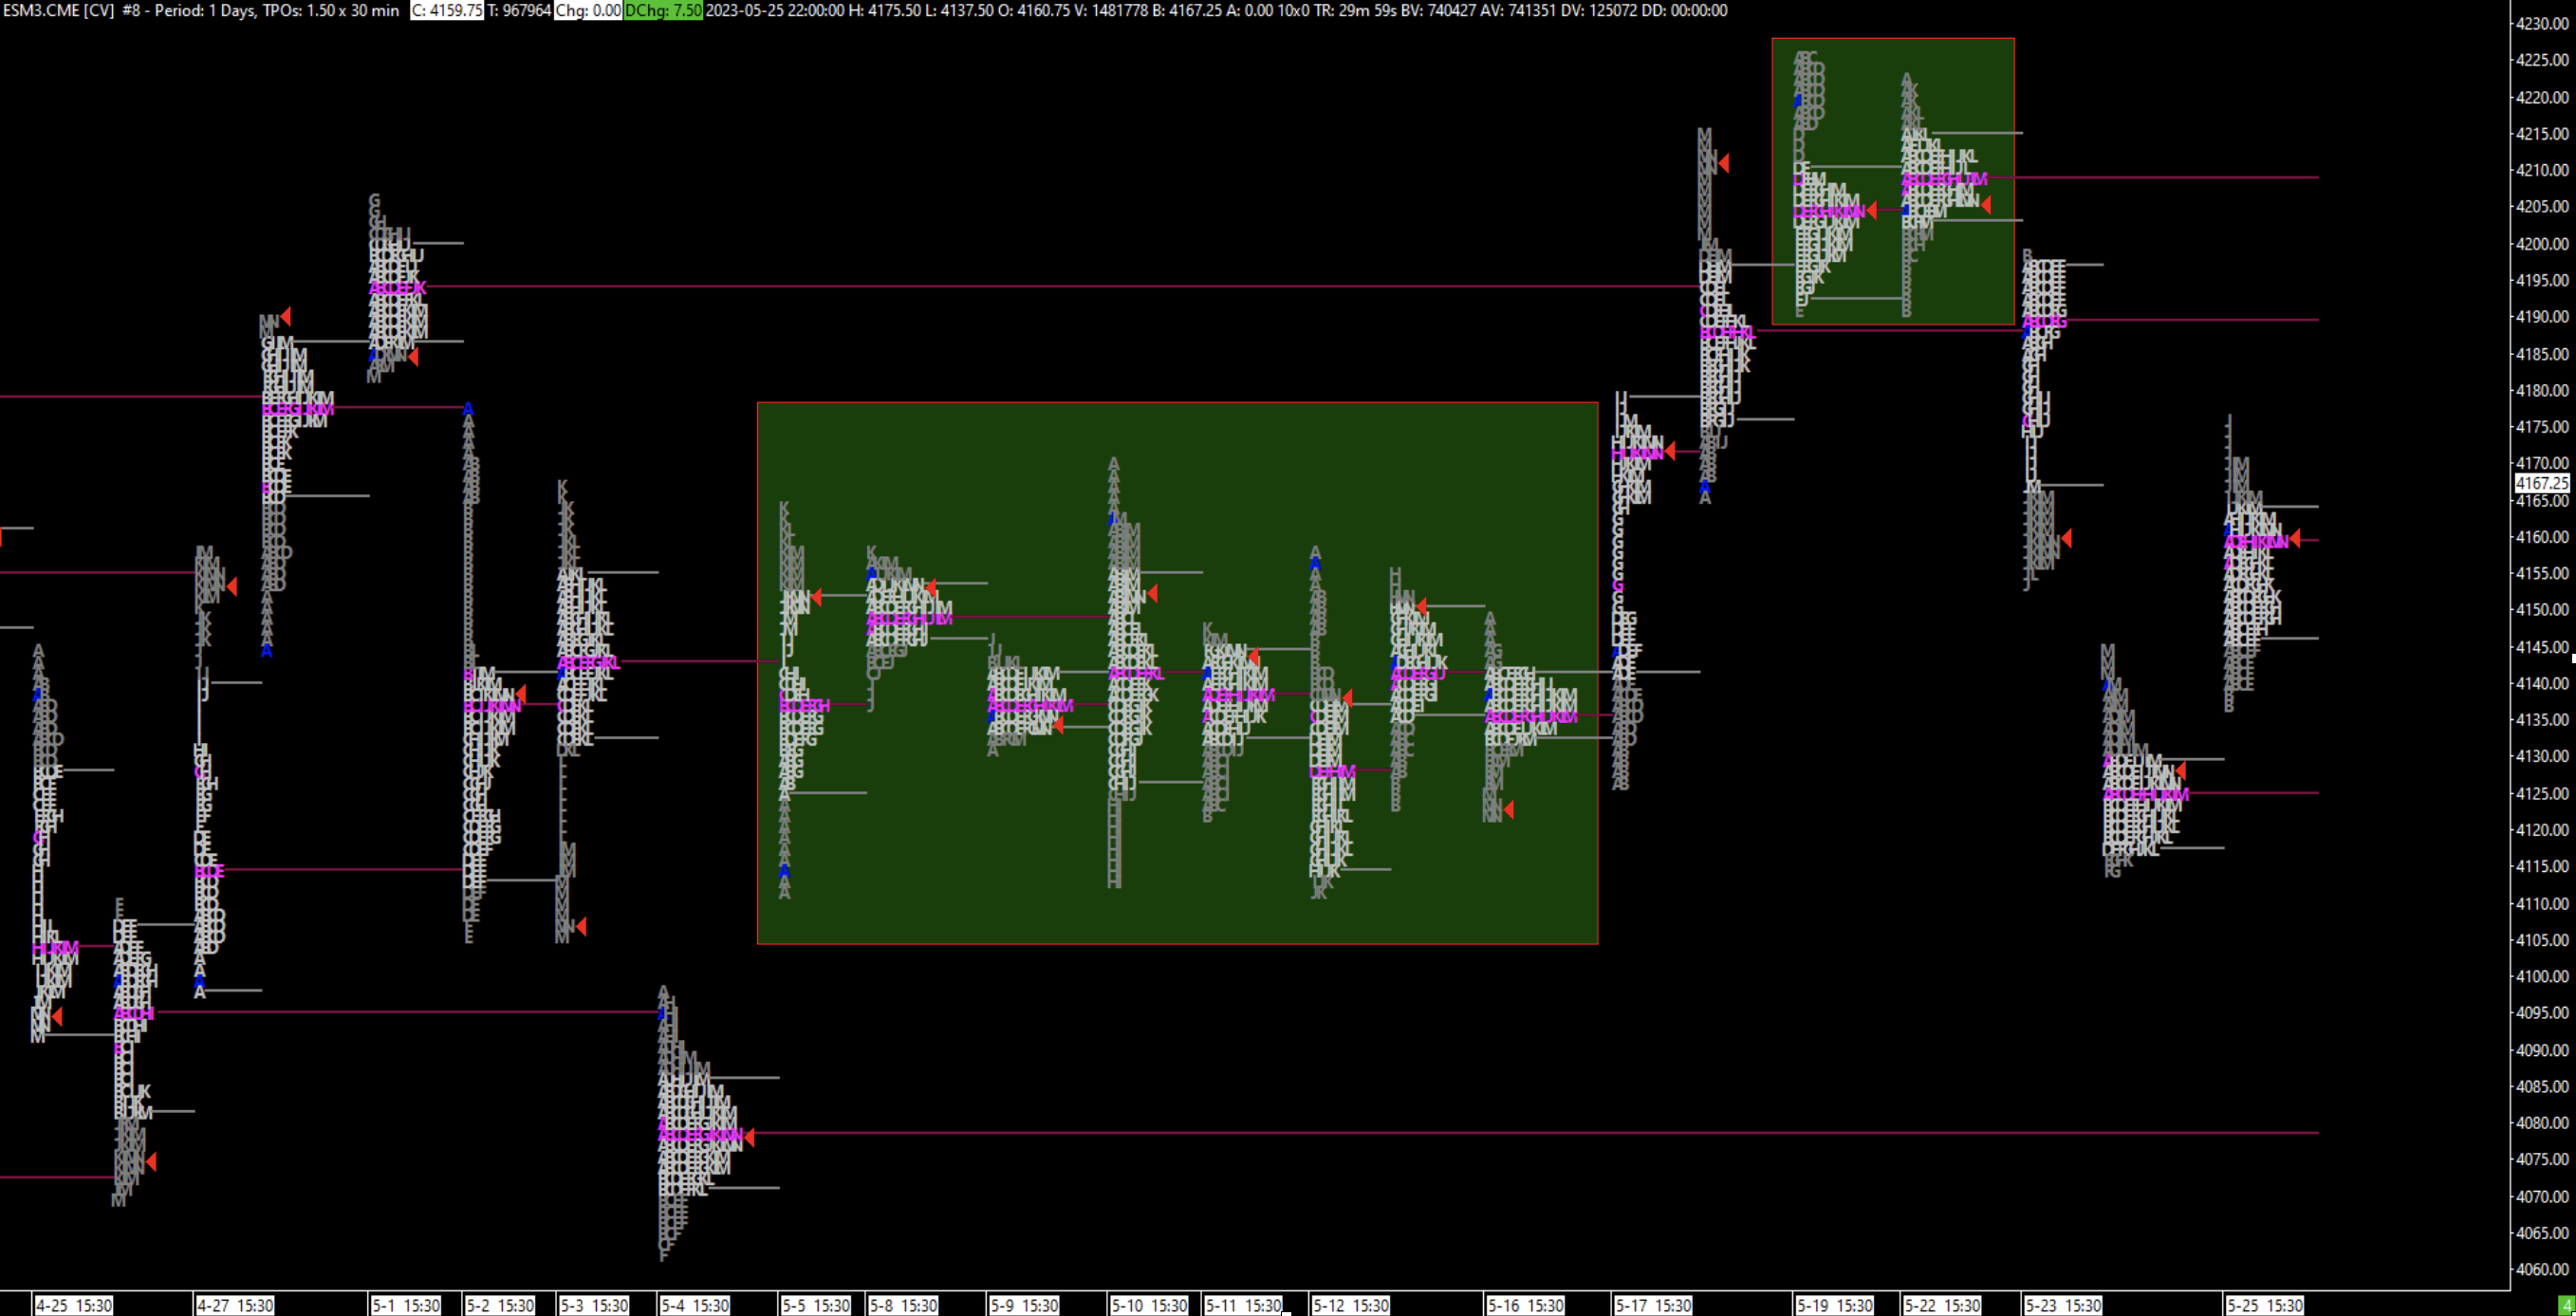
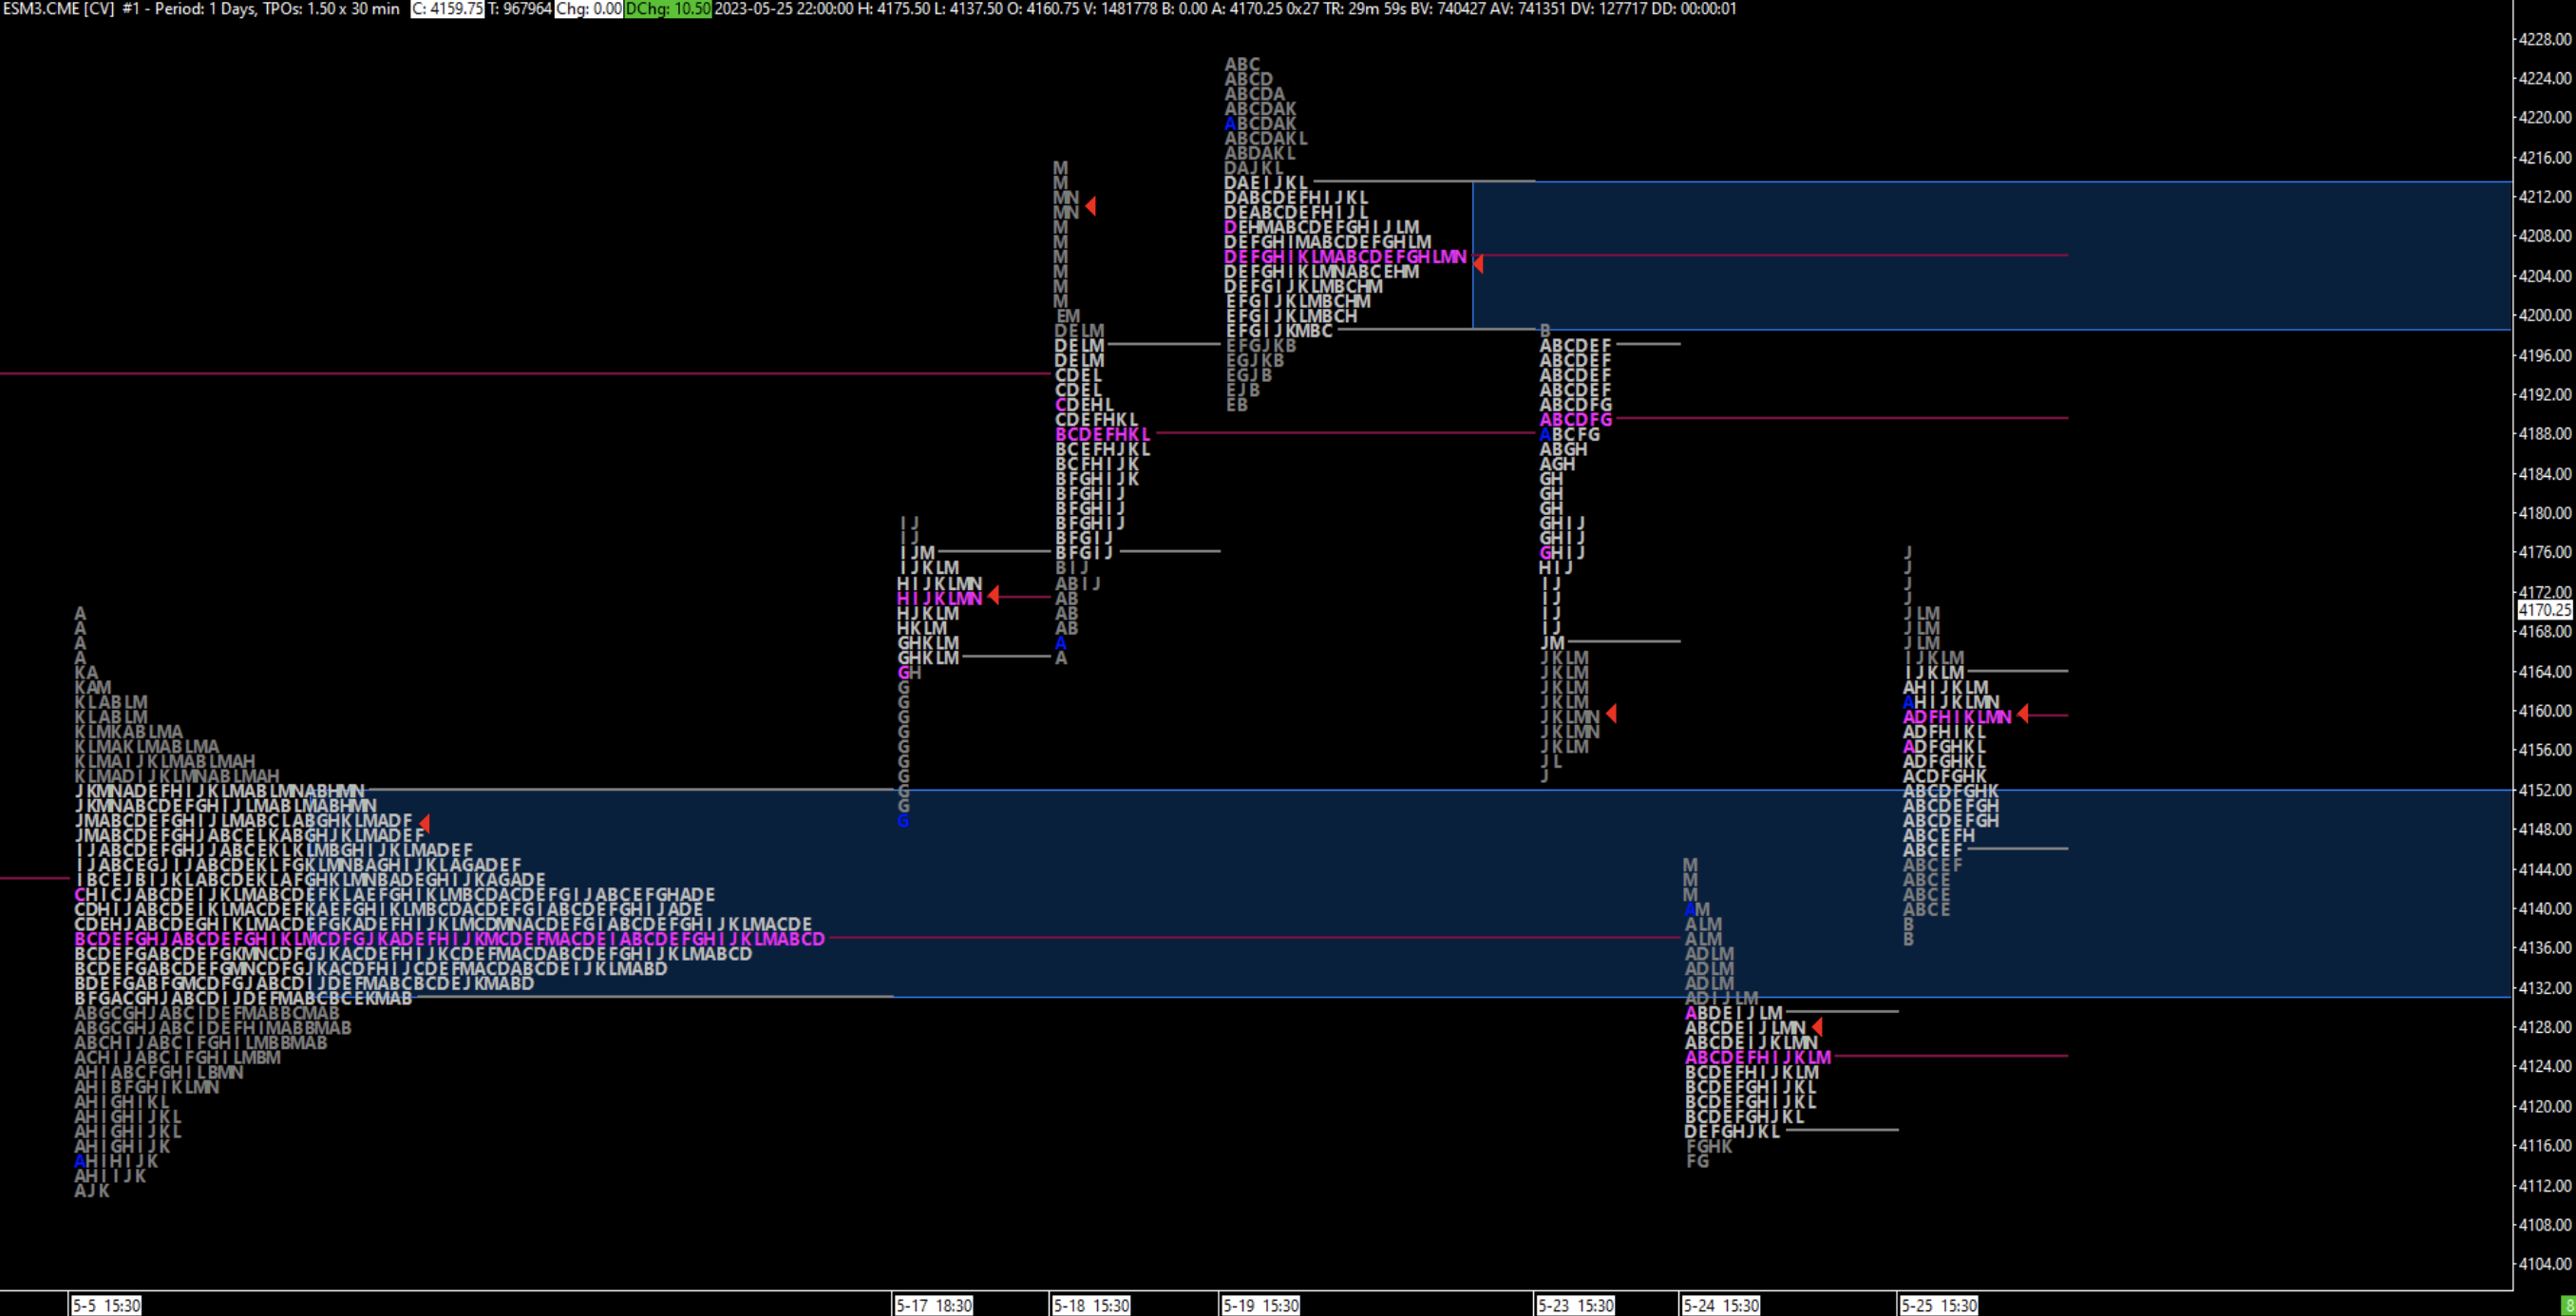
In Figure No.1 we see the TPO display of the past month. However, we can clearly identify areas where the price struggled to leave the established price equilibrium (marked in green). Based on the splitting and merging of specific single-day profiles, we can discern the cumulative value zone (Figure No.2). The given approach is highly effective in identifying the current market regime.
Figure No.1
TPO
Source: Stonebridge Capital, CME Group
Figure No.2
The Cumulative Value Zone
Source: Stonebridge Capital, CME Group
Long Term VWAP
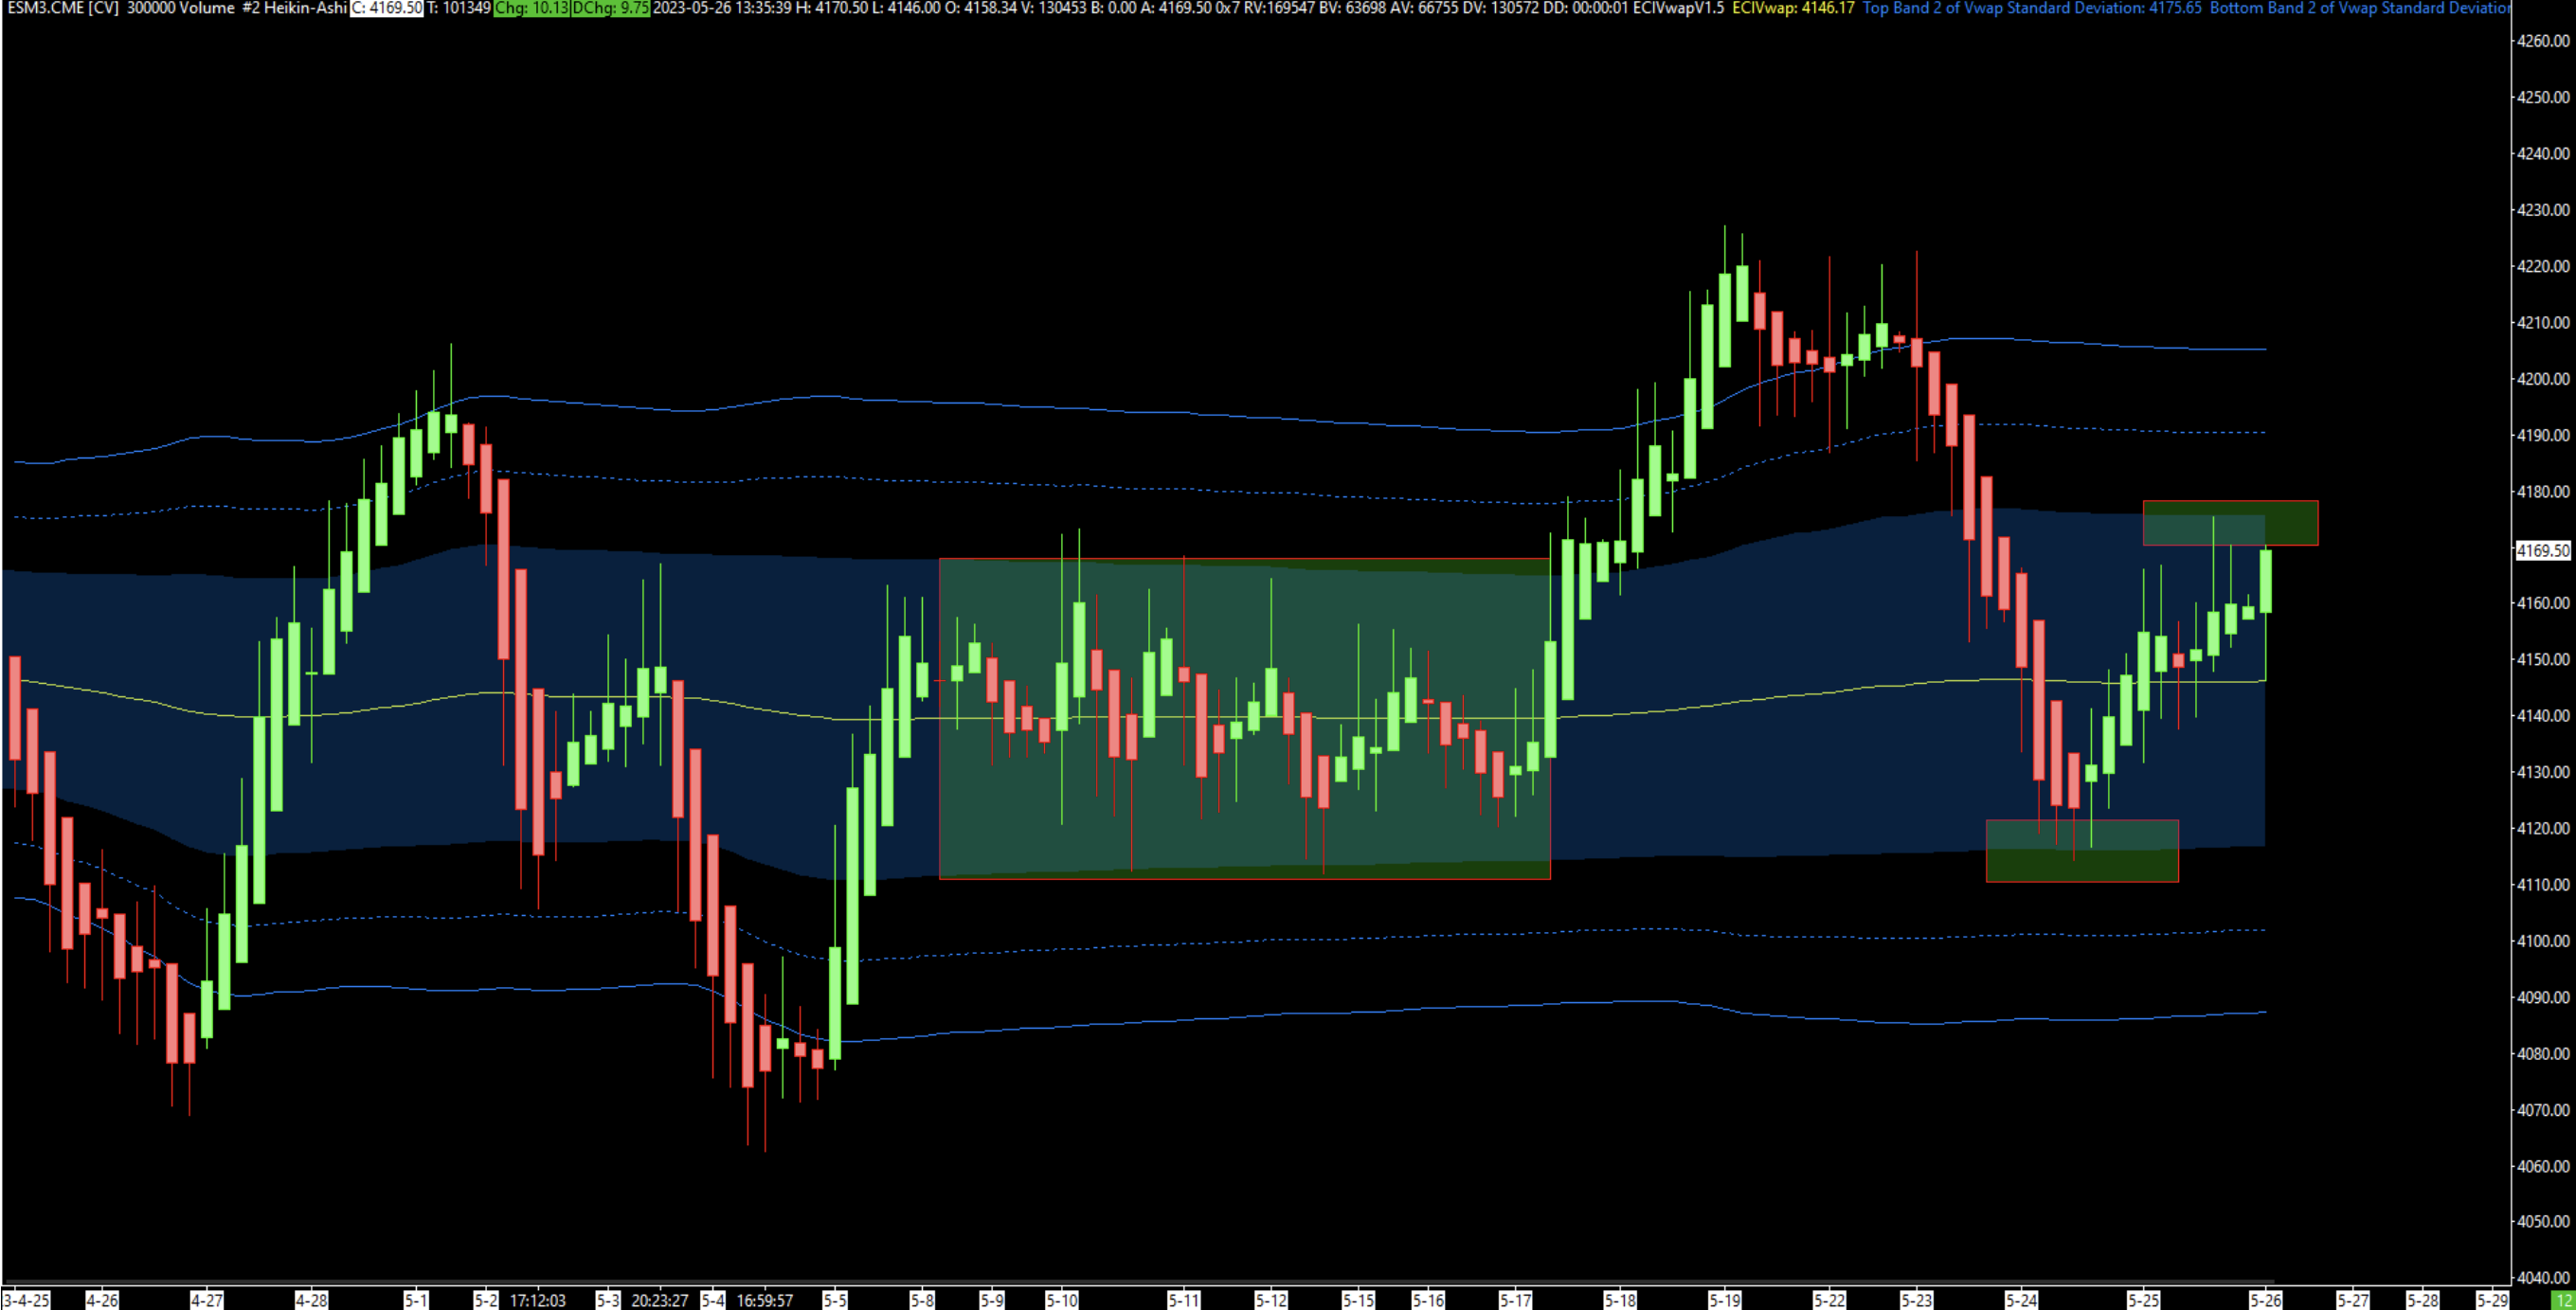
As we explained in the previous part of Auction Theory, using VWAP, we can measure the so-called developing value zone. However, VWAP is not limited to a 1-day period. The most commonly used periodicities (besides daily) are weekly, monthly, quarterly, and yearly. The period we observed over the past month displayed on the quarterly VWAP clearly confirms the narrative arising from the profiles (Figure No.3).
Figure No.3
Quarterly VWAP
Source: Stonebridge Capital, CME Group
Narrative Building
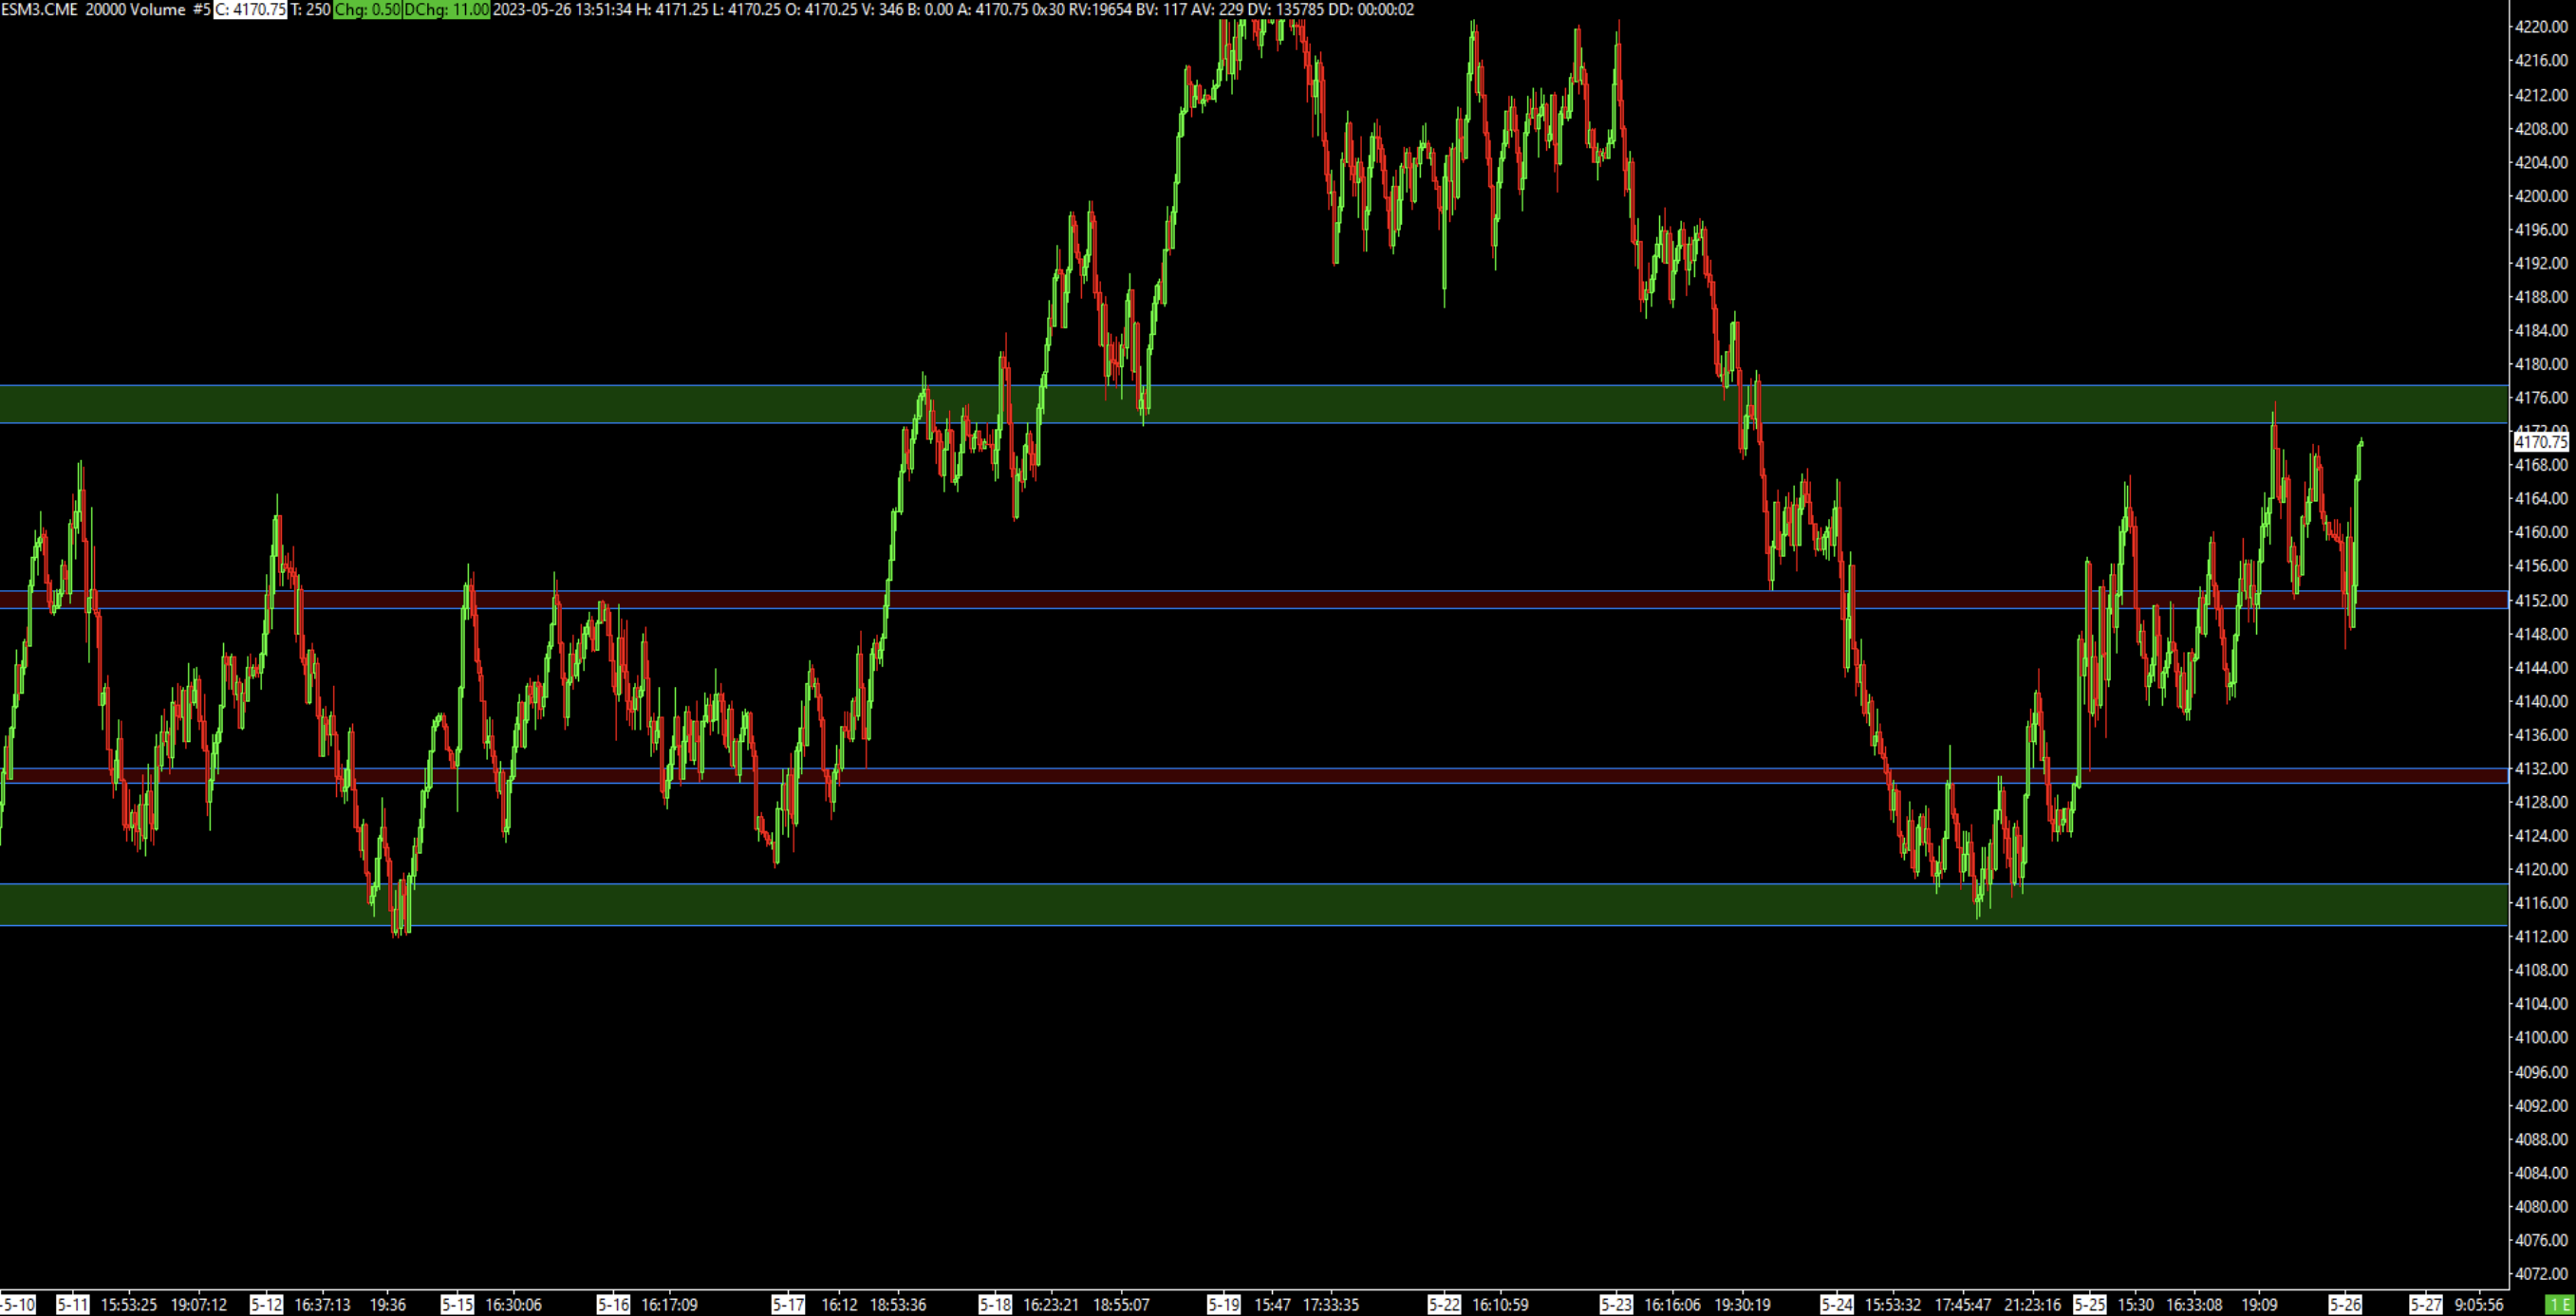
Price during the 8 trading days between May 8th and 18th rotated across the created value zone. In the second half of the session on May 18th, buyers managed to gain the upper hand, and an upward imbalance was created. However, it was not accepted, and the price slid back into the safety of equilibrium. One does not have to be an expert in technical analysis to conclude that the main inflection points of the current price development have occurred on the chart.
In Figure No.4, we have marked the edges of the quarterly forming value zone in green and the edges of the cumulative profile in red.
Figure No.4
Narrative
Source: Stonebridge Capital, CME Group
From a practical standpoint, we can draw two main conclusions.
1.) If the price fails to accept outside of equilibrium, we can continue to expect a rotational environment, where the most effective strategy is the so-called “fading the extreme” or entering positions assuming a return to the mean.
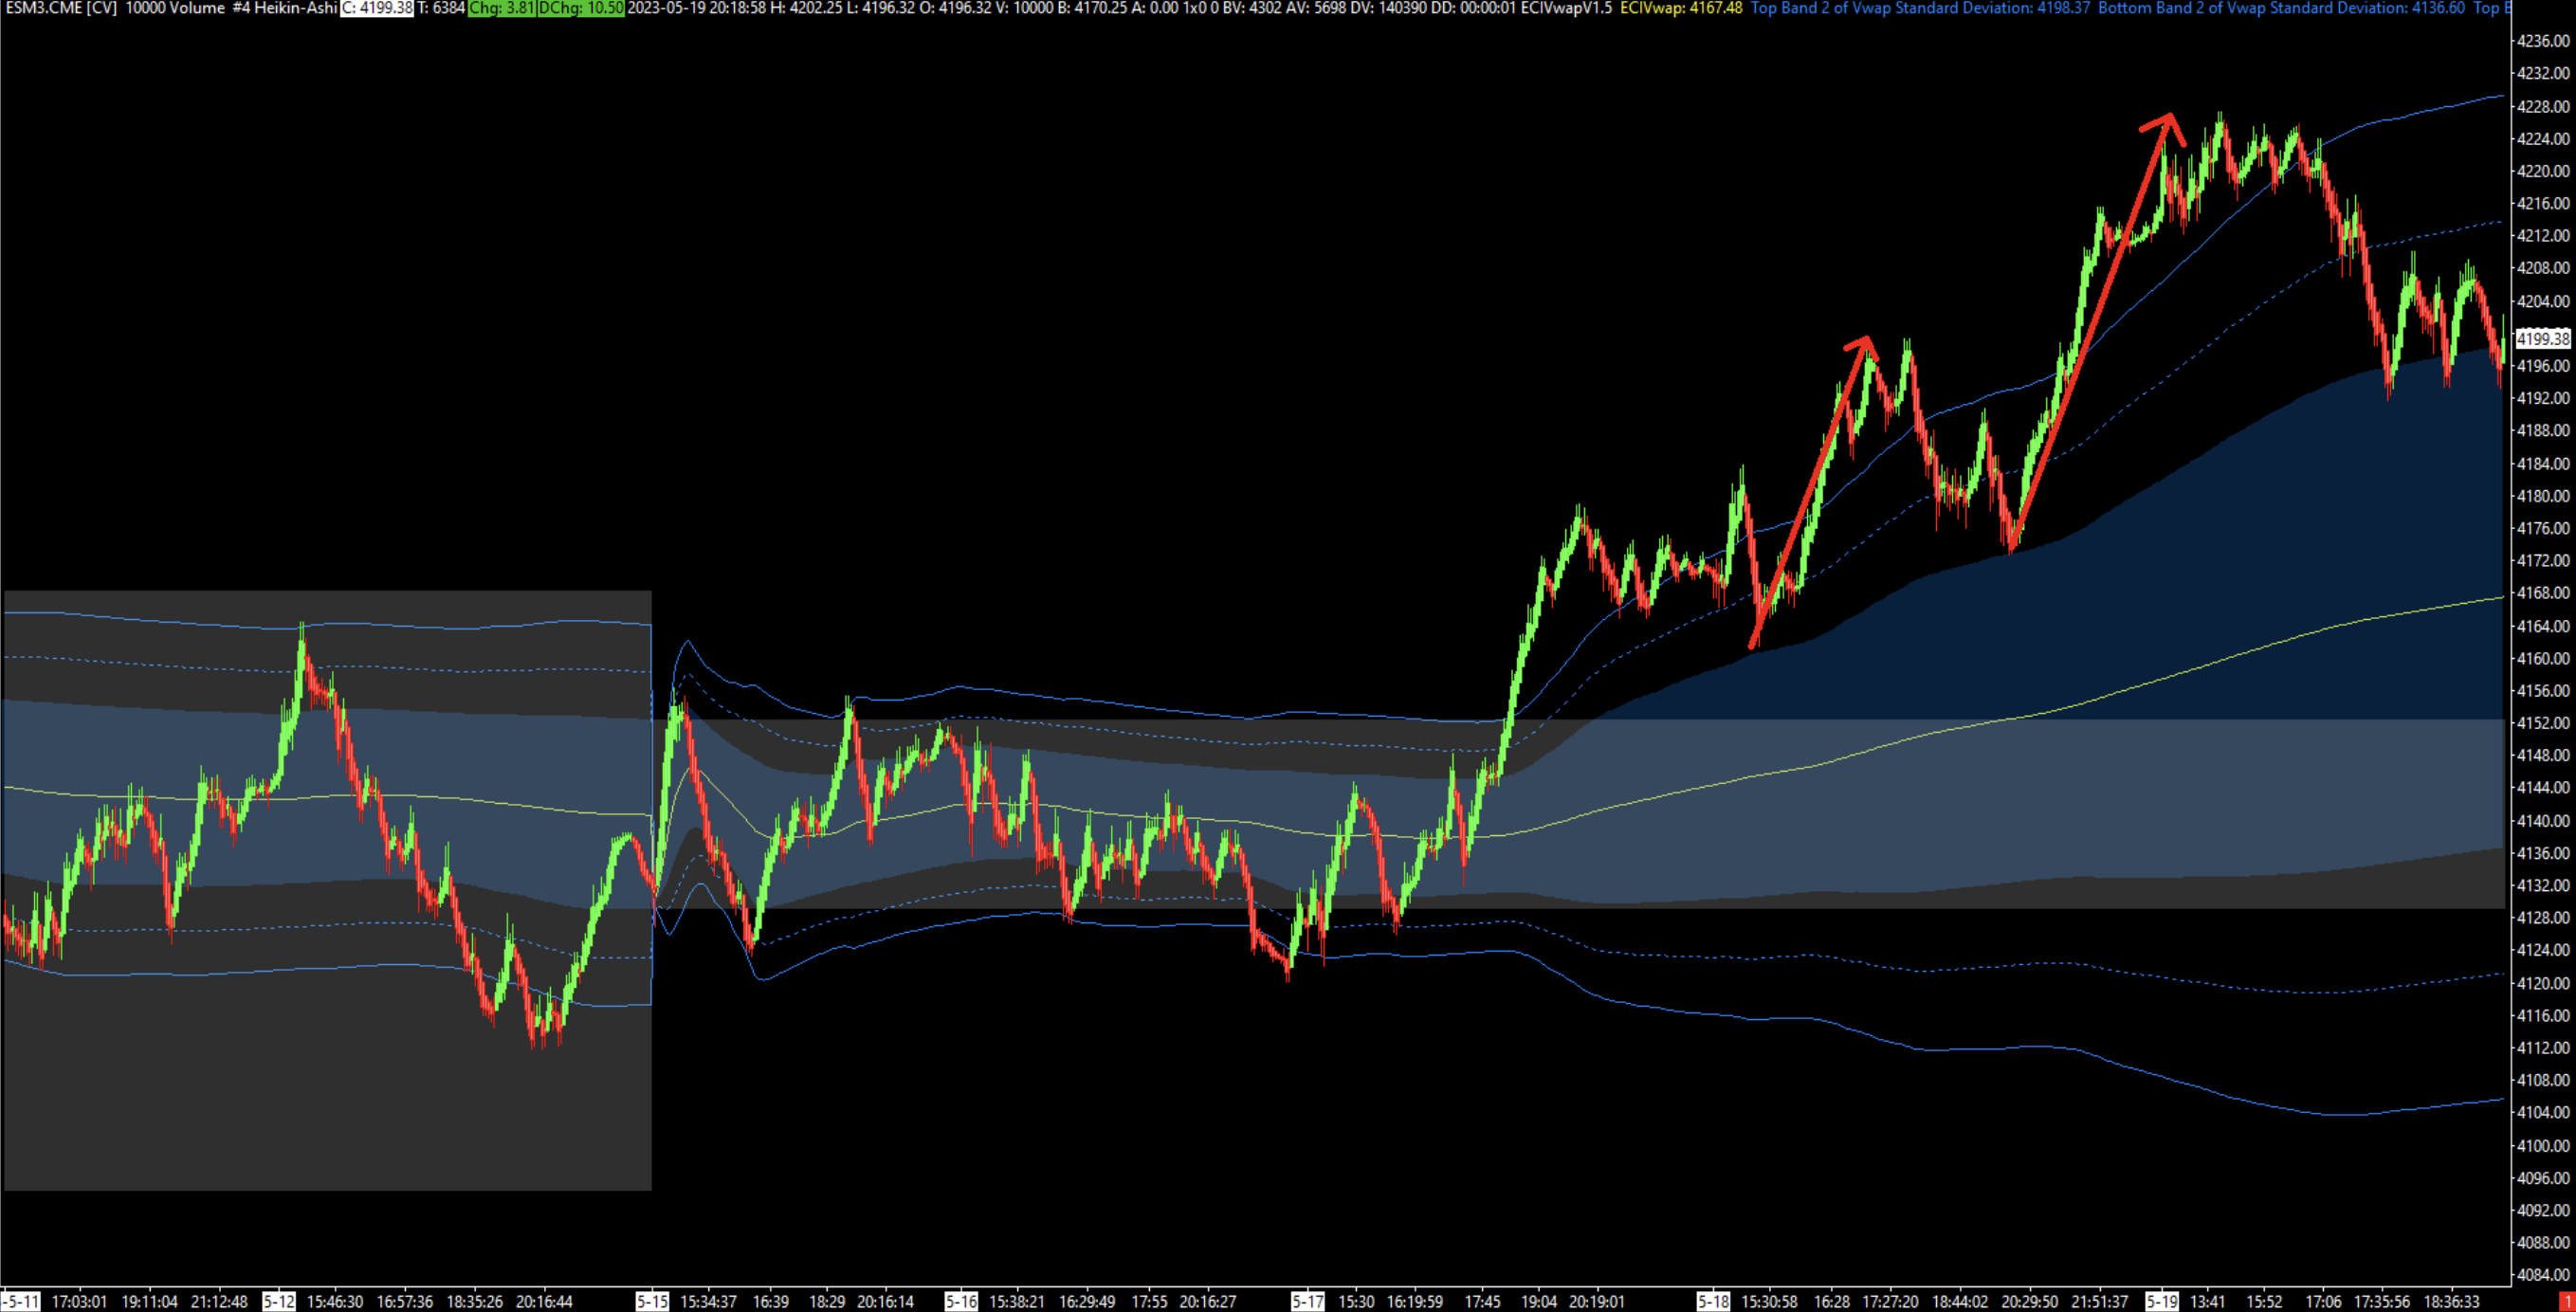
2.) If the price manages to accept, for example, above the equilibrium zone, we can infer that the market is entering an imbalanced state. In this case, the strategy of reverting to the mean would incur significant losses. Therefore, in an imbalanced regime, our goal is to enter positions in the direction of the trend, at appropriate price levels. To identify these values, mid-term VWAP, for example, can assist us (Figure No.5).
Figure No.5
Weekly VWAP
Source: Stonebridge Capital, CME Group
Summary of key information:
- The market profile typically displays each day in a separate profile. However, by splitting and merging profiles, we can create a cumulative picture of the state of equilibrium.
- Long-term VWAPs can be utilized to observe forming value from a bird’s-eye perspective.
- Based on the analysis of multiple timeframes, we can identify inflection points where the equilibrium state changes to imbalanced.
- In the equilibrium state, strategies utilizing mean reversion work best. Conversely, in the imbalanced state, trend-following strategies excel.
Our knowledge associated with AMT stems from the practical application of these concepts in real trades within our multi-strategy approach.

Author: Ľuboš Polakovič, Junior Trader Hedge Fund Stonebridge Capital


